When you work for a news app and there’s lots of news, you’re busy.
At SmartNews we’ve been busy trying to get a handle on the numbers behind the Coronavirus pandemic and present it in a way that is meaningful to SmartNews users.
We started with a simple widget with totals for confirmed cases along with those that had recovered. We designed a way to put US and Global numbers in once widget that updated daily. Tapping on the More data link to you to a full page with interactive graphs showing the cumulative totals of these numbers over time along with the death count.

As casualties grew and recovery data started to look inconsistent (it’s not clear when you recover and many states do not require hospitals to record recovery rates), we made the difficult decision to post the death count on the widget, replacing the recovered figure. We re-built the data pipeline to pull in data more frequently so we added a counter to show the current daily totals compared to yesterday’s total.
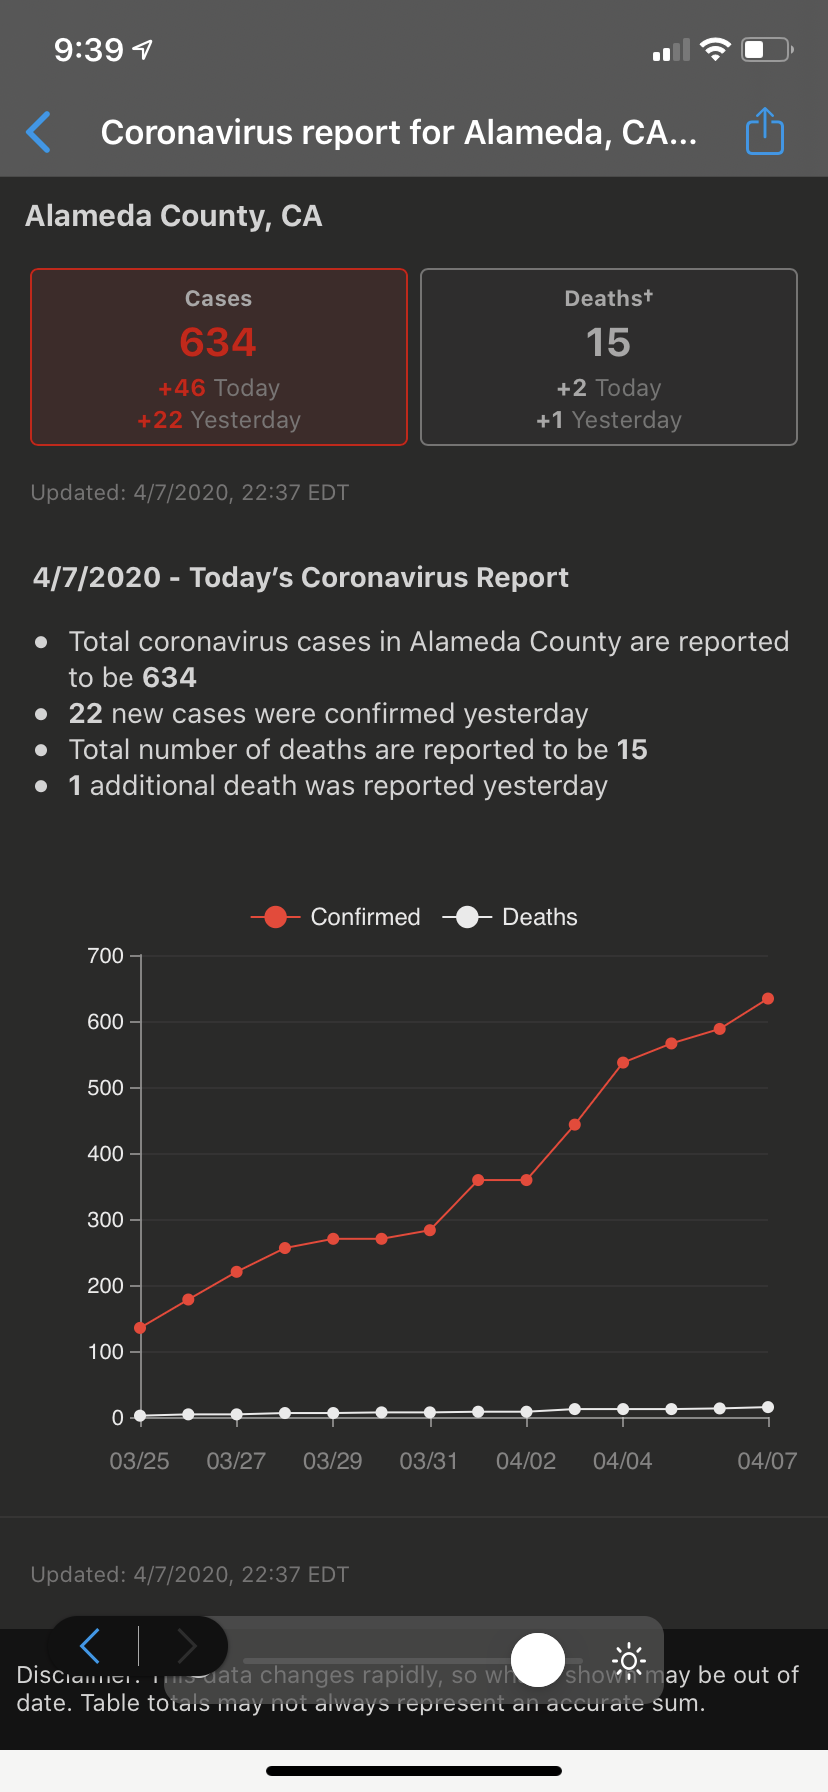
Then we added county-level data to satisfy the growing interest in local information.


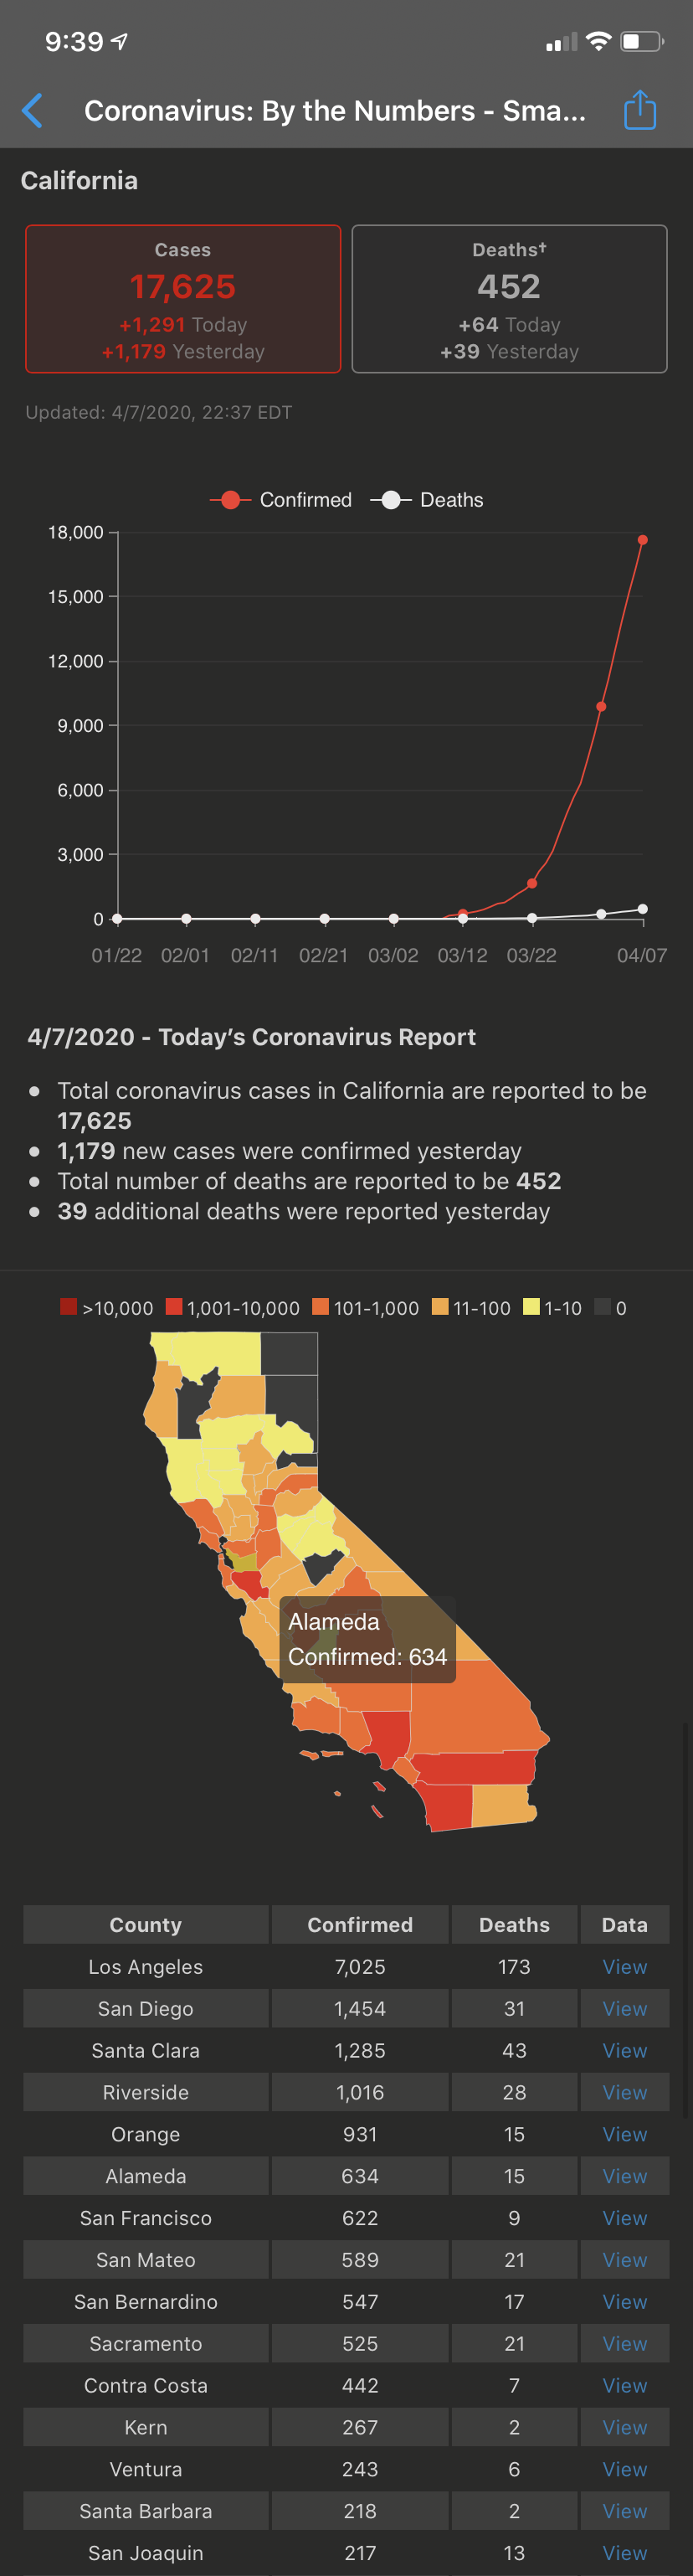
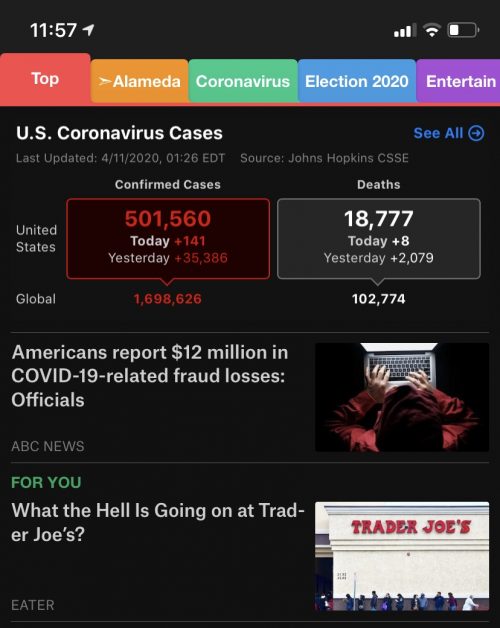
The most recent iteration, in the app today, adds back in the global number to give context to the US figures. We’ll continue to iterate on this widget to bring the most useful information to our users.
Leave a comment